
Capabilities
High-precision airborne laser scanning across wide and complex environments, generating and visualizing 3D spatial information tailored to the intended purpose.
FEATURE 01 Flight
Wide-area surveying
Our engine-powered aircraft offers up to 100 minutes of flight endurance and high operational availability, enabling efficient wide-area surveys. Even when the survey site is some distance from the launch point, the long flight endurance leaves ample time for surveying once the aircraft reaches the site. Refueling is all that is required before the next flight, avoiding interruptions for lengthy battery charging. Even in regions with limited power infrastructure, surveying can continue as long as gasoline is available, enabling sustained surveying over large areas and extended periods.
Performance in steep terrain and adverse weather
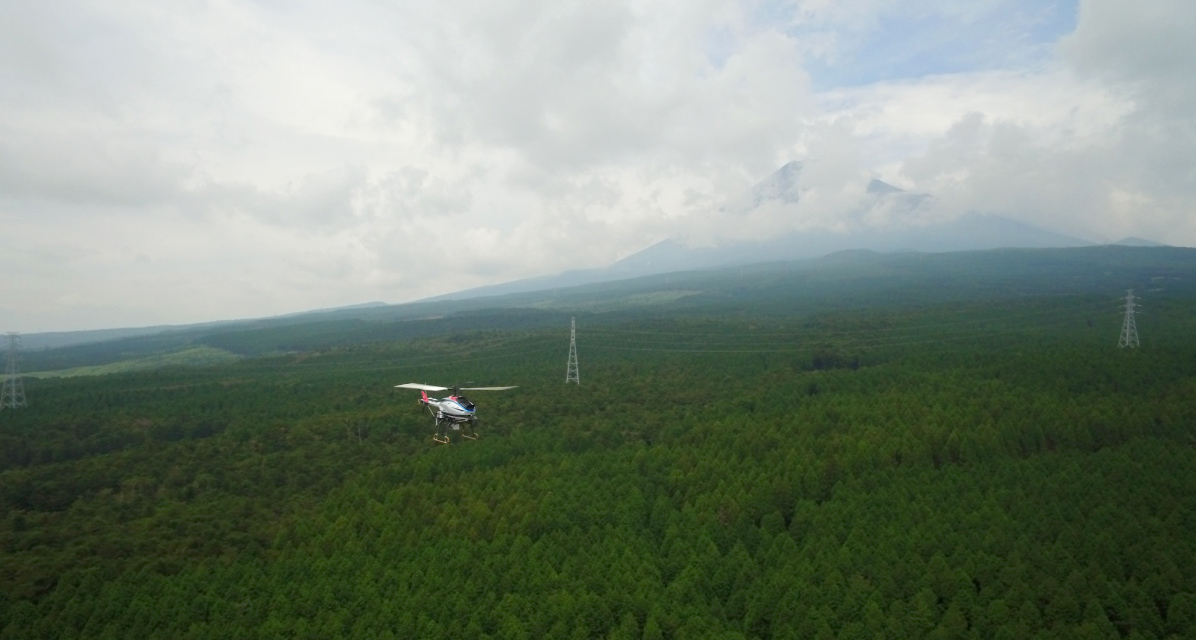
Strong terrain-following capability and wind resistance allow the aircraft to conduct surveys in steep mountainous terrain and wind-exposed environments. Flight parameters are optimized for the terrain and survey conditions, allowing the aircraft to follow the planned flight lines while maintaining a constant height above ground as the terrain rises and falls. The aircraft’s large single-rotor design contributes to this wind resistance, enabling operation under demanding flight conditions. We have built an extensive track record of aerial surveying in complex mountainous terrain in Japan, and our unmanned helicopters have also operated in a wide range of overseas environments, including the United States, Brazil, Australia, Thailand, and South Korea.
Precise and stable flight
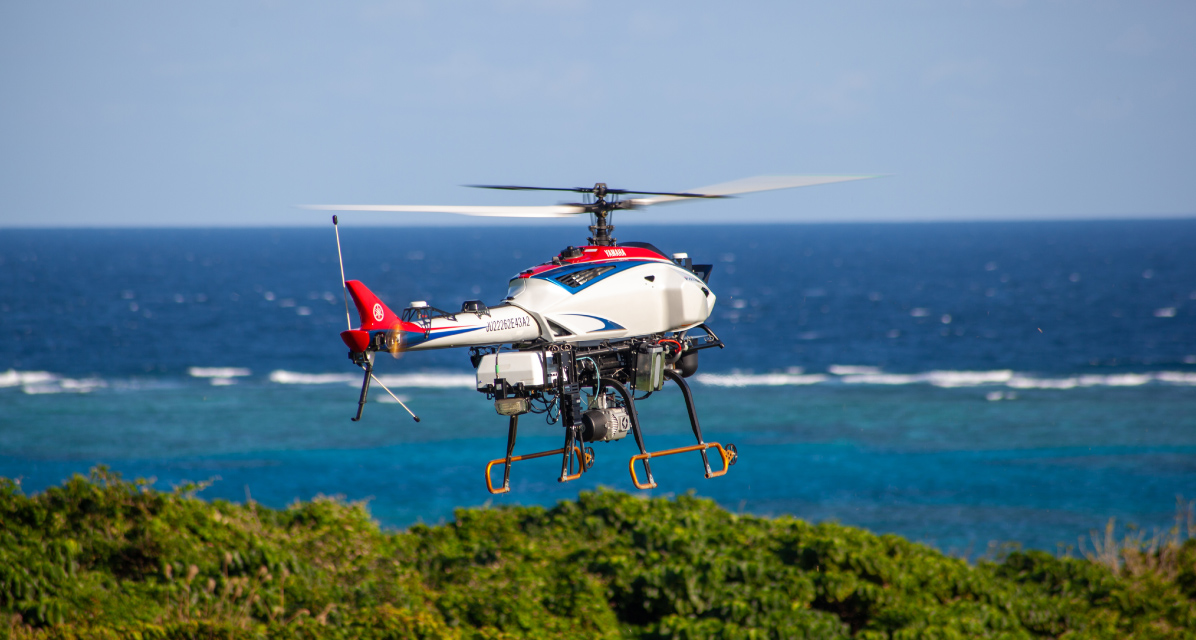
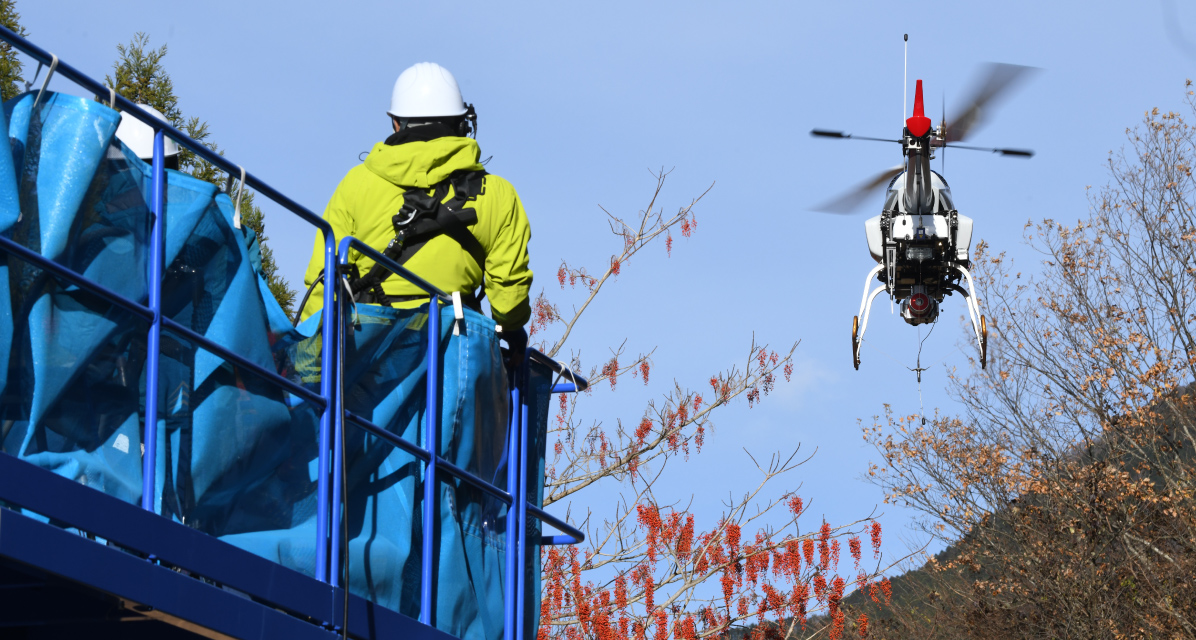
High airframe stability and precise flight control allow the aircraft to follow planned flight lines accurately and consistently, supporting high-quality data acquisition. Automated flight and beyond visual line of sight (BVLOS) operations using satellite communications are also supported. In addition, safe operating practices and risk-assessment criteria developed over approximately 40 years in Japan’s agricultural sector, together with licensed professional pilots, support consistent and reliable aerial surveying.
FEATURE
02
Point Cloud Acquisition &
Generation
Optimized flight route design
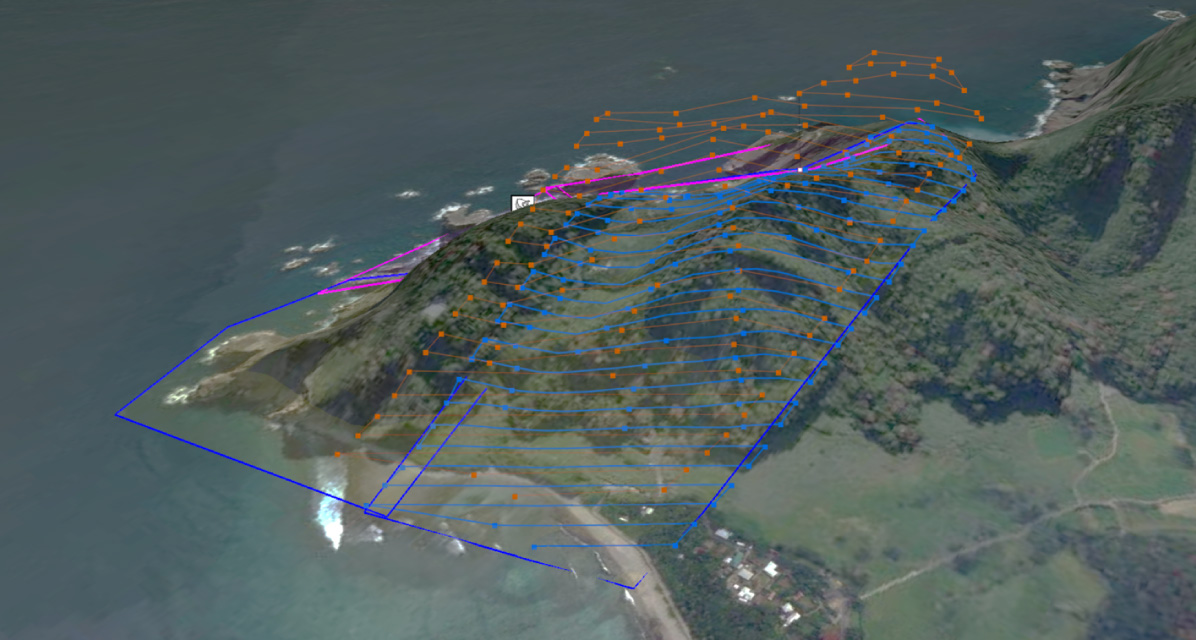
To acquire the required data, we determine the optimal flight lines, altitude, and speed for the survey target and terrain. Terrain-following flight at altitudes of 80 to 120 m above ground and speeds of 3 to 5 m/s enables high-density data acquisition. With up to 100 minutes of flight endurance, the aircraft can complete detailed surveys even at low speeds. Rather than allowing aircraft limitations to dictate the survey method, we design each survey around the required data.
Reaching every part of a complex forest
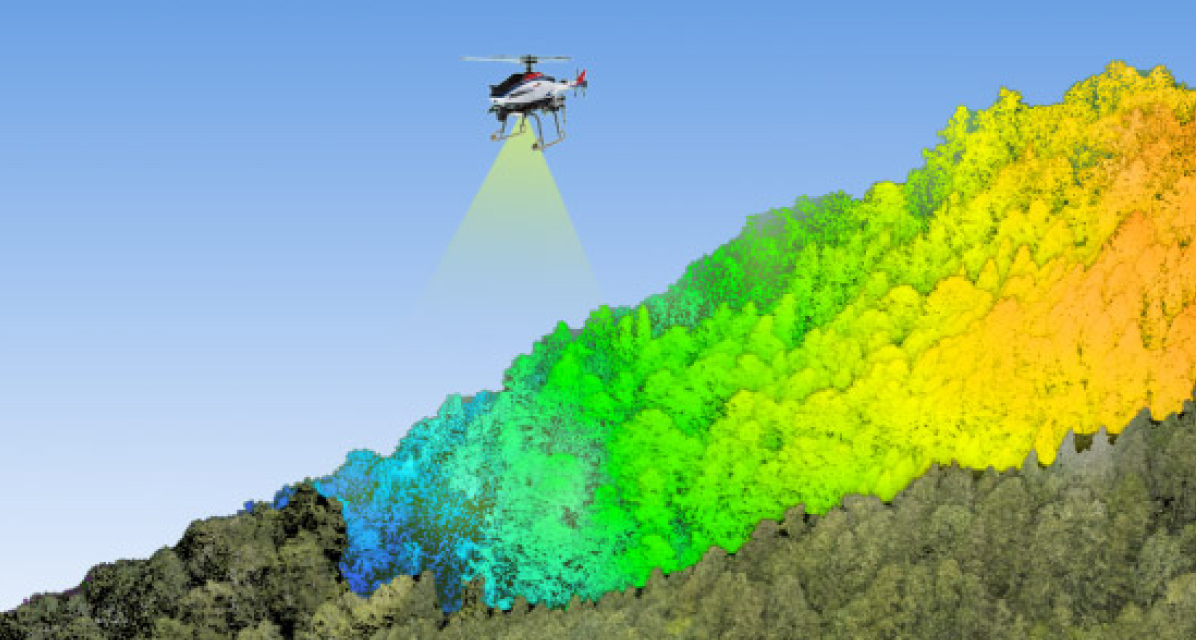
The sensor emits laser pulses at high density across a wide field of view, covering 100° across-track and ±10° along-track, rather than only at nadir. Recording multiple returns from each laser pulse captures not only the first returns from the canopy and the last returns from the ground, but also intermediate returns from branches, leaves, and understory vegetation. Pulses that pass through gaps in the foliage and reach the ground help capture the forest’s full vertical structure, from the upper canopy through the subcanopy and understory to the ground surface, in detailed three-dimensional data.
Point density and accuracy comparable to terrestrial laser scanning
Stable low-altitude, low-speed flight is combined with LiDAR settings matched to flight altitude and speed, achieving high pulse density and high-precision point cloud generation. Point density exceeds 3,000 points per square meter, and trajectory processing using a high-performance GNSS/IMU achieves accuracy within 10 cm both horizontally and vertically. By optimizing flight method and LiDAR configuration as a single integrated system, we achieve—from the air—point cloud quality comparable to terrestrial laser scanning (TLS) across wide areas. Beyond the canopy surface and the ground, the complex subcanopy structure is captured as well, providing data that can also be applied to biodiversity assessment.
FEATURE
03
Data Analysis &
Visualization
Generating 3D spatial information
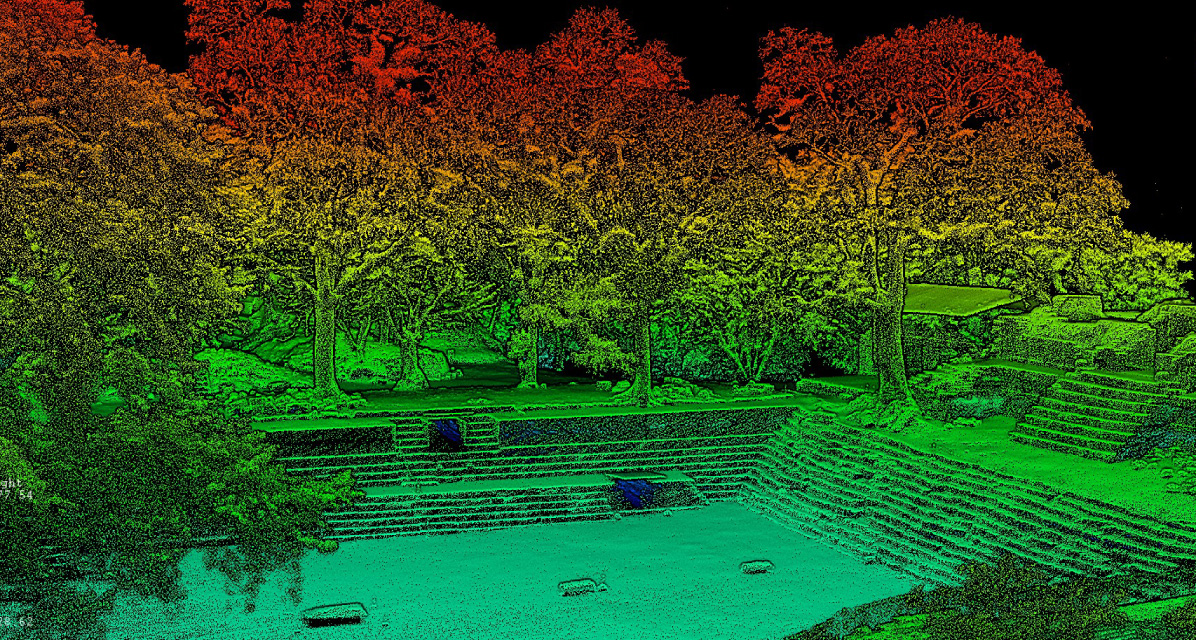
The acquired and processed point cloud is transformed into high-resolution, georeferenced 3D spatial information. By reconstructing the surveyed environment in three dimensions, targets can be viewed and examined from any angle. Coordinates within the 3D space also enable quantitative measurement of each target’s position, distance, height, size, volume, and other attributes. This supports detailed analysis and assessment of the surveyed area without repeated site visits.
Visualizing the layered structure of the survey area
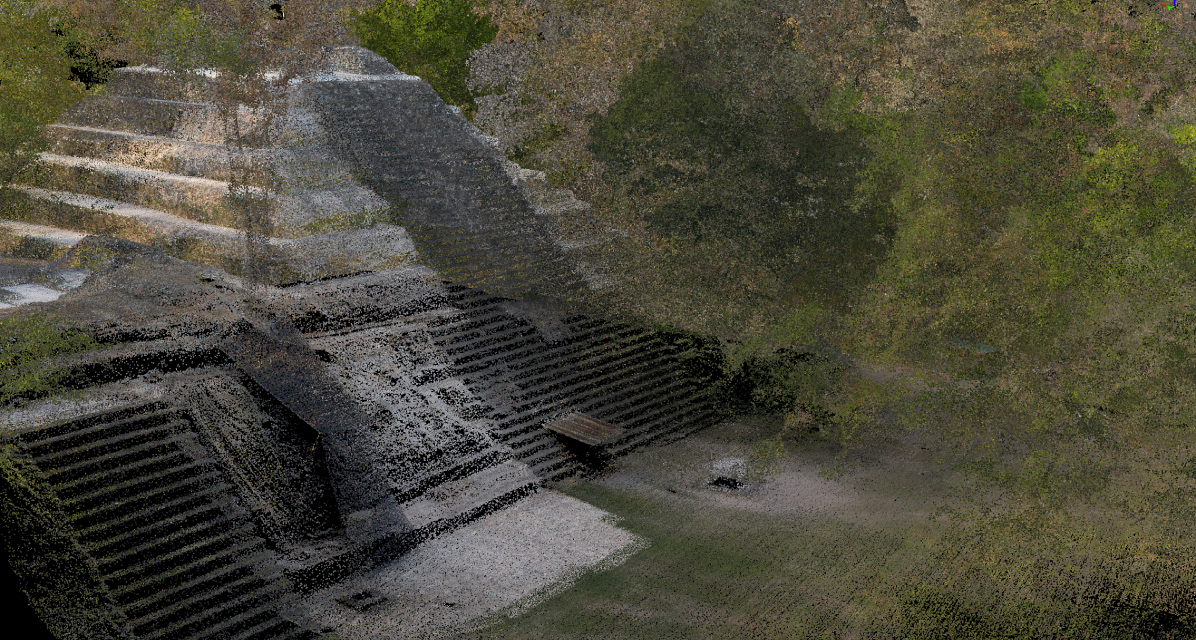
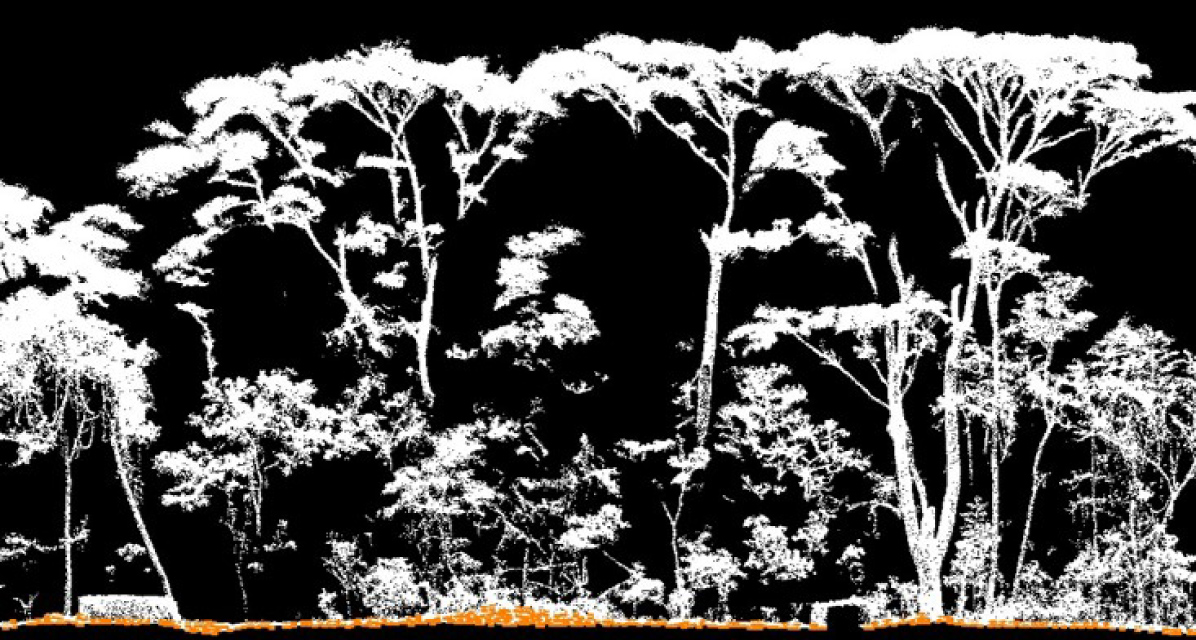
Capturing not only the canopy surface but the subcanopy and understory hidden beneath it at high pulse density makes the vertical structure within the survey area visible as three-dimensional data. Ground filtering separates and extracts the vegetation-covered ground surface from the remaining returns, allowing structures on the ground and fine landform features to be visualized. Furthermore, even in forests with complex overlapping vegetation, our proprietary algorithms detect and delineate individual trees, enabling individual-tree-level analysis of stem position, tree height, stem diameter, and other attributes.
Visualizing microtopography beneath vegetation in detail
From the high-density point cloud containing returns from beneath the vegetation, our refined proprietary ground-filtering algorithm classifies and extracts ground returns, allowing vegetation-covered terrain to be visualized in detail. Generating a DTM at a grid size of 25 cm or less from a point cloud of 3,000 points per square meter reproduces the ground surface that trees and undergrowth conceal from above. As a result, undulations and terrain changes of only a few tens of centimeters are resolved, giving a detailed picture of microtopography within the forest and also supporting the interpretation of structures and anthropogenic traces concealed beneath vegetation.
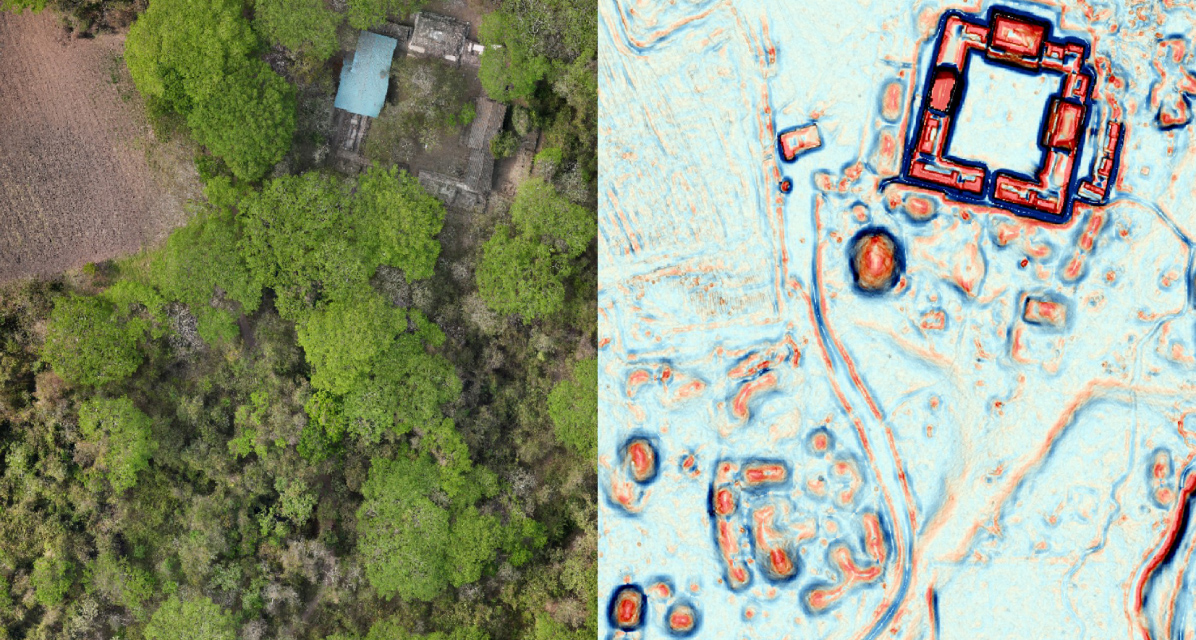
Visualization and outputs tailored to the intended purpose
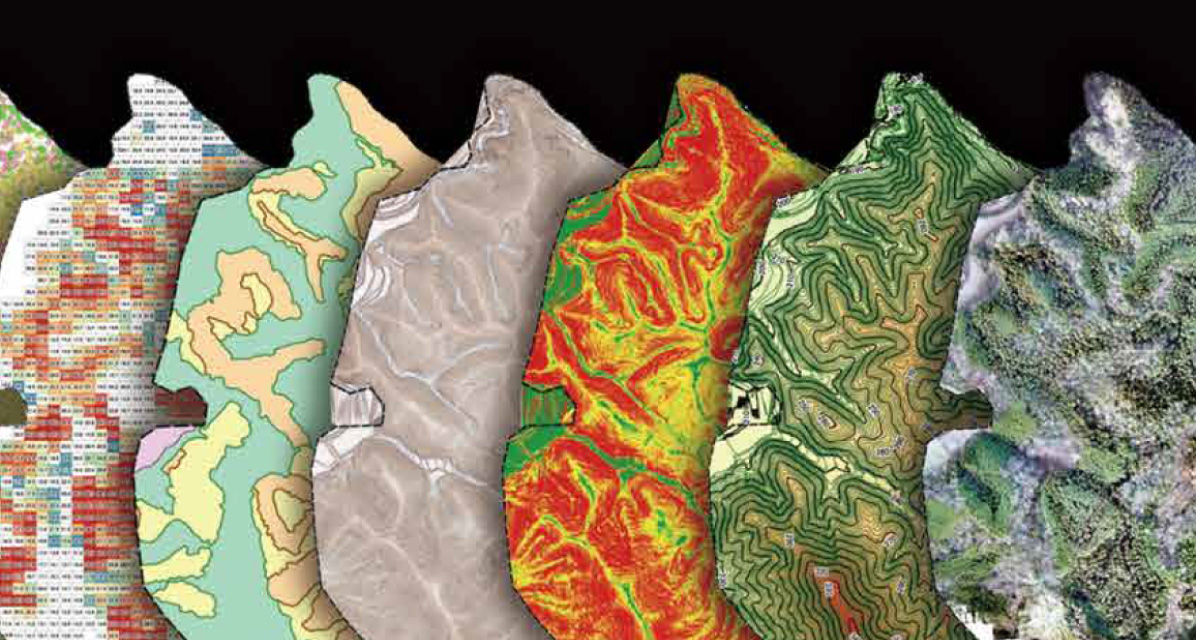
From the acquired and analyzed 3D spatial information, we extract the information required for each application and deliver it in readily usable formats, including GIS-compatible datasets, maps, cross-sections, and analytical outputs. Rather than providing vast point cloud data as-is, we organize it into information that makes the condition and characteristics of the target easy to grasp, delivering results that can be applied across a range of investigations and analyses.
 Contact us
