Riding data analysis : Y-TRAC Rev
Revs Your Heart – Explore the world of Yamaha motorcycles

Compare rides against past logs to track progress and create an action plan for future rides.
Use the visualized riding results to easily select the optimal vehicle settings.
Checking Riding Logs
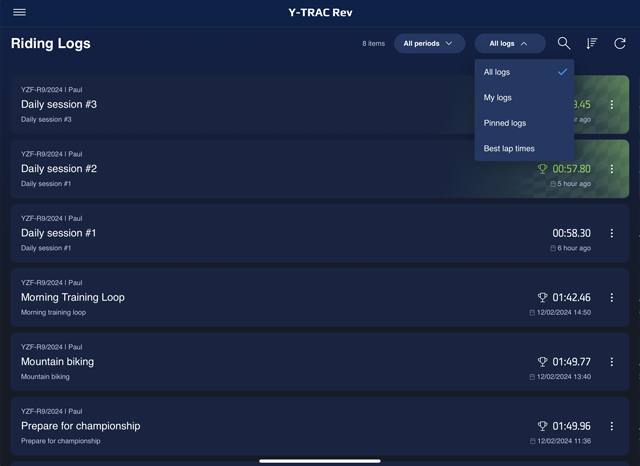
List of riding logs
List and check riding logs at a glance.
(historical and shared driving records).
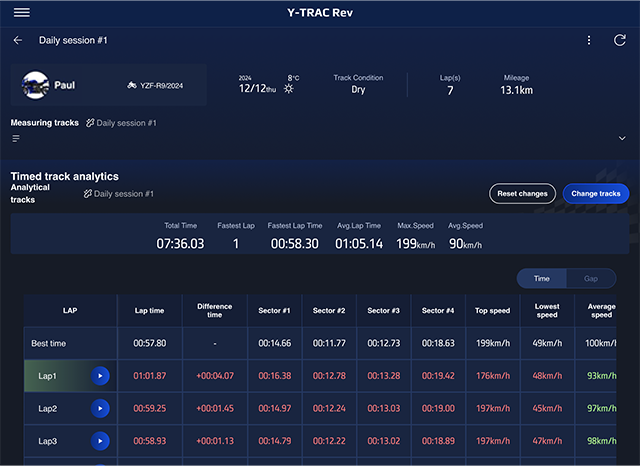
Riding logs details
View details of stored driving records.
(Summary + time information specifically dedicated to checking the time for each LAP/sector).
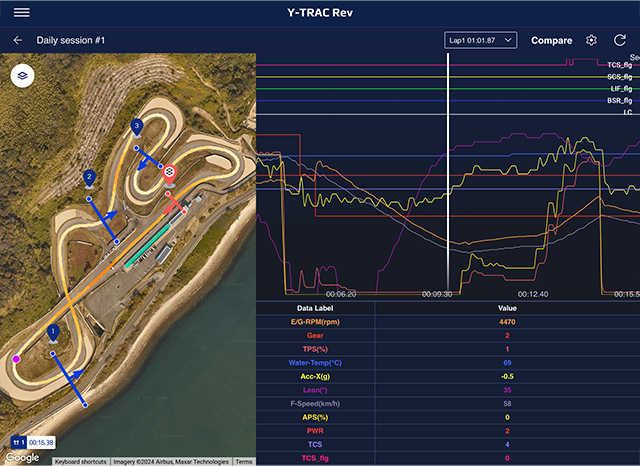
Analysis of riding logs
The driving record can be analysed to reflect on the ride, make suggestions and discover insights for the next ride.It also allows comparison with own driving data in the past.
(location information, vehicle CAN information time axis displayed in combination).
Riding log list
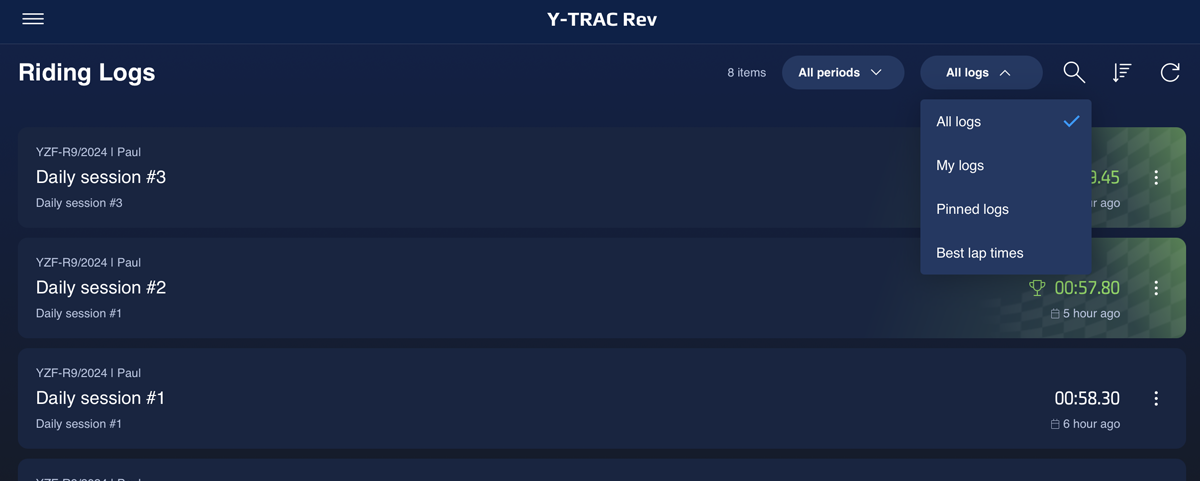
Riding logs are sorted chronologically with the latest logs shown first. You can also sort by log date or track name and filter searches by log type.
* Riding log retention period: 3 years
Riding Log List Screen Details
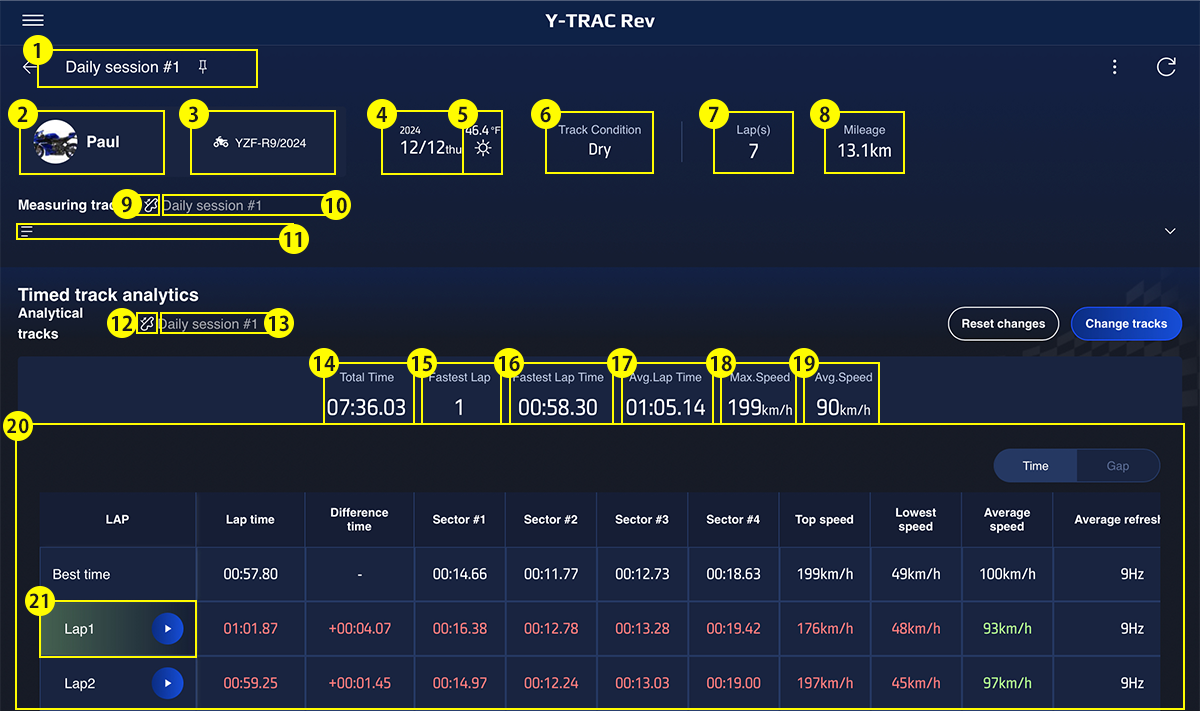
|
1 |
Riding Log Title | Displays the riding log title. |
|---|---|---|
|
2 |
Rider Information | Displays the rider's icon and nickname. |
|
3 |
Vehicle Model/Year | Displays the model and year associated with the selected riding log. |
|
4 |
Riding Log Date | Displays the date of the log in YYYY/MM/DD format. |
|
5 |
Weather Information | Displays the weather icon and temperature linked from Y-Connect. |
|
6 |
Track Condition | Displays any additional track conditions noted by the user. (optional) |
|
7 |
Total Laps | Displays the total number of laps for the selected riding log. |
|
8 |
Total Riding Distance | Displays the total mileage for the selected riding log. |
|
9 |
Timed Track Icon | If a timed track is set, the icon for the type of track set (track or rally) will be displayed. |
|
10 |
Name of the Timed Track | Displays the name of the track being applied to the selected riding log. |
|
11 |
Notes | Displays any notes left by the user. (optional) |
|
12 |
Analyzed Timed Track Icon | If a timed track is set to be analyzed, the icon for the type of track set (track or rally) will be displayed. |
|
13 |
Name of the Analyzed Timed Track | Displays the name of the analyzed track being applied to the selected riding log. |
|
14 |
Total Riding Time | Displays the total riding time for the selected riding log. |
|
15 |
Fastest Lap | Displays the lap with the fastest time recorded for the selected riding log. |
|
16 |
Fastest Lap Time | Displays the fastest lap time recorded for the selected riding log. |
|
17 |
Average Lap Time (for the selected log) | Calculates and displays the average lap time for the selected riding log. |
|
18 |
Top Speed (for the selected log) | Displays the top speed recorded for the selected riding log. |
|
19 |
Average Speed (for the selected log) | Displays the average speed recorded for the selected riding log. |
|
20 |
Lap Times | Lap time details are displayed based on the selected riding log and track layout. |
|
21 |
Fastest Lap Icon | The fastest lap within the riding record is highlighted. |
Riding log analysis screen
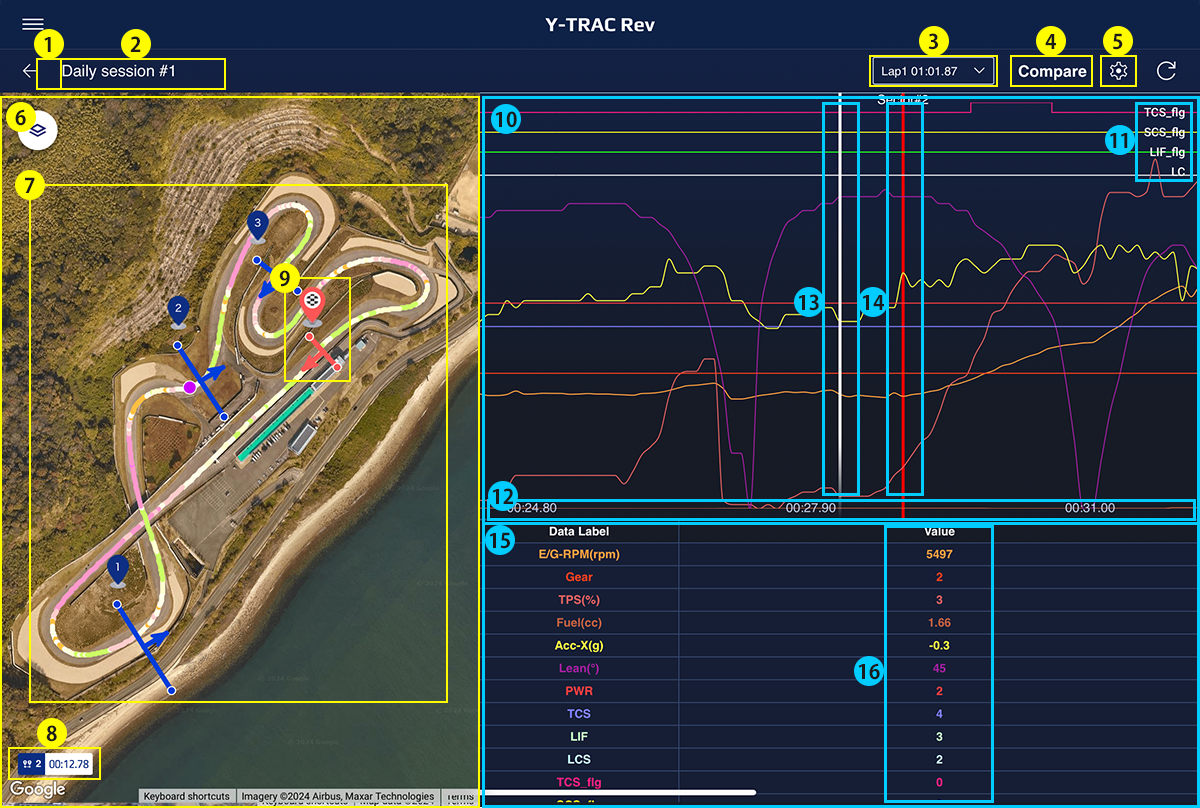
|
1 |
Pinned icon |
Only display the pinned icon if the riding log is pinned. *Unlimited plan only |
|---|---|---|
|
2 |
Riding log title | Display the title of the riding log. |
|
3 |
Lap selection button | Expand the list of laps in the current riding log and select the lap to be analysed. The list displays the name of the lap and the total time for each lap. |
|
4 |
Compare button | Transition to the riding log comparison selection screen with the data of the lap being displayed as the comparison source. |
|
5 |
Setting | Display a pop-up that allows two MAP settings and graph settings. |
|
6 |
Map | Initial display of the map at a position and scale where all the lines of the track for analysis are displayed. |
|
7 |
Itinerary |
The position information of the laps to be analysed is lined up and drawn and displayed as a riding trajectory. The trajectory is displayed in a gradation display city, with the initial display being the acceleration (deceleration G). |
|
8 |
Actual sector time | Display the actual time of the sector (tapped in the driving track). |
|
9 |
Line Information |
Displays the line image on the map. The line type (S/F, S, F, Sector number) is also displayed, red if the line type is S/F, S, F, blue otherwise. |
|
10 |
Graph | Graphical display of the transition of each item of vehicle CAN information within the target lap, with the x-axis as the time axis. |
|
11 |
Flag item name | Display the graph position of each flag item. |
|
12 |
Elapsed time | Display elapsed time on the X-axis. |
|
13 |
Analytical line | Draw lines to indicate the position of the various CAN information values in the list of items. |
|
14 |
Sector line | Draw sector lines at the line passing positions of the analysis track. |
|
15 |
Item list |
Displays a list of the vehicle CAN information currently selected for display. Each item value displays the value at the position of the analysis line in the graph. |
|
16 |
Item value | Display the item values for the analysis line positions in the graph. |
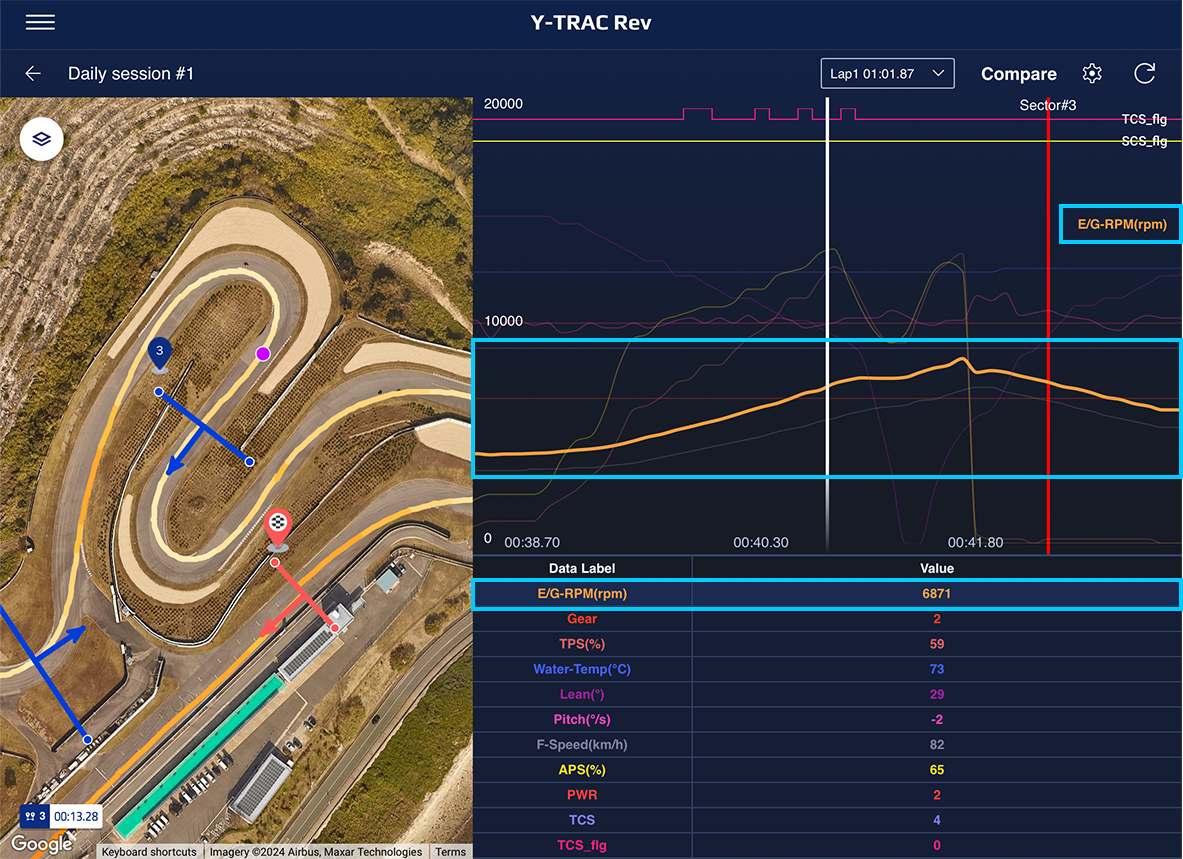
The transition of the analysis item being displayed is drawn in a line graph and the name of the corresponding item is displayed. Highlight (bold line) the line on the graph for the item that has been selected for highlighting in the item list.

You can change the display by tapping each marker, graph, or item and using flick or pinch gestures.
Riding Log Comparison Screen
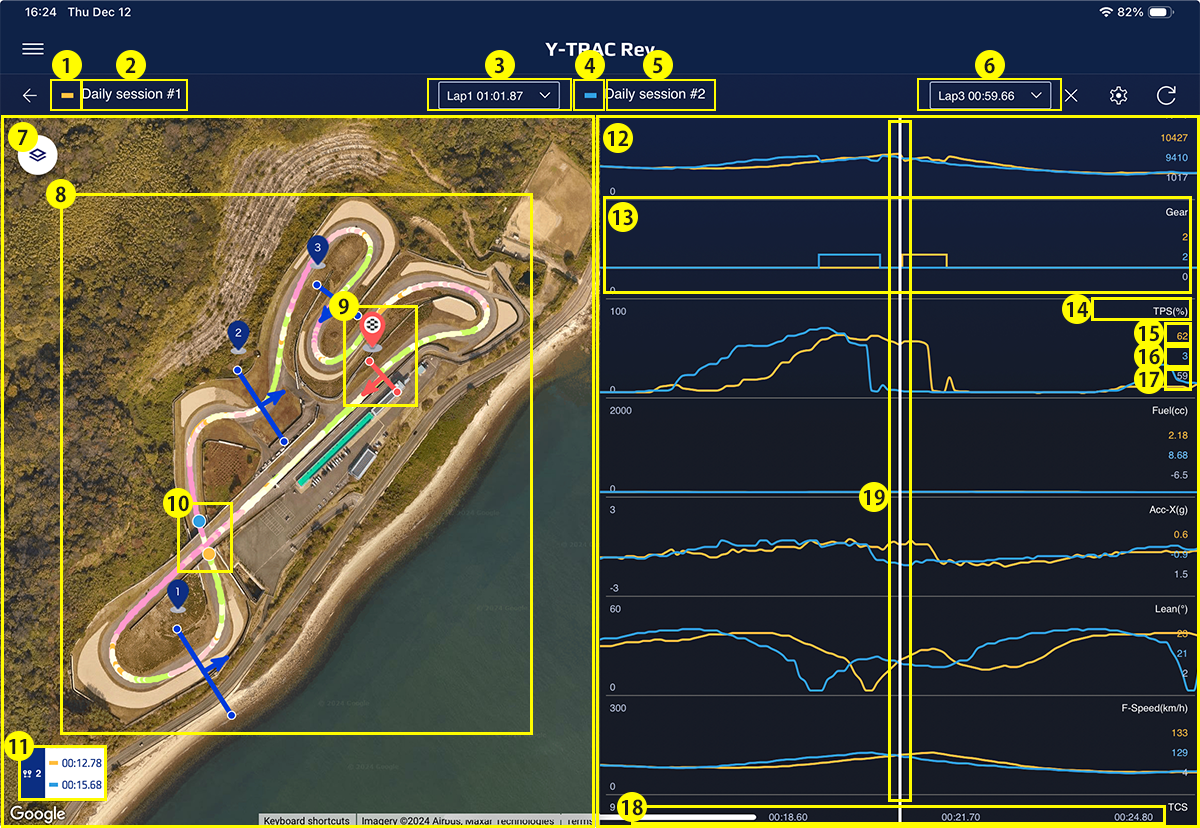
|
1 |
Data Set A | Displays data set A's graph as an image. |
|---|---|---|
|
2 |
Riding Log Title A | Displays data set A's riding log title. |
|
3 |
Lap A | Displays data set A's lap number and lap time. |
|
4 |
Data Set B | Displays data set B's graph as an image. |
|
5 |
Riding Log Title B | Displays data set B’s riding log title. |
|
6 |
Comparison destination riding log title | Display the title of the riding log to be compared. |
|
7 |
Map | The map is initially displayed at a position and scale that shows all the points of the timed track. |
|
8 |
Riding Path | Shows the location information for data set A and B, and plots the riding path for each. |
|
9 |
Line Information | Displays the line icons on the map. |
|
10 |
User Icon | Displays user icons for data set A and B in the areas that are being analyzed. |
|
11 |
Actual Sector Times | Displays the actual times for the sector tapped on the riding track. |
|
12 |
Graphs | Displays the vehicle’s CAN information trends for the related lap on a graph, with the X-axis as time or distance traveled. |
|
13 |
Analyzed Item Graph | Displays the trends of the item being analyzed as a line graph. |
|
14 |
Item Name | Displays the name and unit of the item being analyzed. |
|
15 |
Item Value (Data Set A) | Displays the item value for data set A as analyzed on the line graph. |
|
16 |
Item Value (Data Set B) | Displays the item value for data set B as analyzed on the line graph. |
|
17 |
Item Value (Difference) | Displays the difference in the item values for data set A and B as analyzed on the line graph. |
|
18 |
X-axis Scale | Displays the X-axis scale (elapsed time or distance). |
|
19 |
Line-based Analytics | Displays the values for CAN information items as line graphs. |
Available Riding Data
| Item name | Displayed name | Description |
|---|---|---|
| Engine RPM [Graph item] |
E/G-RPM | Data indicating the number of rotations per minute of the crankshaft inside the engine, allowing specific confirmation of combustion and output conditions. |
| Gear position [Graph item] |
Gear | Displays the current gear position. Assists in making appropriate gear selections and adjustments according to riding styles. |
| Throttle position [Graph item] |
TPS | Indicates the degree of throttle valve opening based on throttle operation. Allows a visual check of the amount of air intake into the engine. |
| Water temperature [Graph item] |
Water-Temp | Displays the coolant temperature of the engine cooling system. Essential data for confirming whether the engine is operating within the proper temperature range. |
| Intake air temperature [Graph item] |
Air-Temp | Indicates the temperature of the air taken into the engine's intake port. Changes in intake air temperature directly affect combustion efficiency and engine performance. |
| Fuel consumption [Graph item] |
Fuel | Shows the amount of fuel consumed during riding. Useful for measuring fuel efficiency and estimating remaining fuel. |
| G-sensor (X-axis) [Graph item] |
Acc-X | Measures the acceleration in the longitudinal direction of the vehicle. Quantifies vehicle behavior during braking and acceleration. |
| G-sensor (Y-axis) [Graph item] |
Acc-Y | Measures the acceleration in the lateral direction of the vehicle. Used to check vehicle stability and behavior in relation to bank angles during cornering. |
| Lean angle [Graph item] |
Lean | Measures the lean angle of the vehicle. Helps quantify the posture of the vehicle during cornering and aids in determining vehicle control. |
| Pitching angle [Graph item] |
Pitch | Indicates the tilt of the vehicle in the longitudinal direction. Useful for understanding the vehicle’s posture during acceleration and deceleration, aiding control decisions. |
| Vehicle speed (front) [Graph item] |
F-Speed | Measures the rotational speed of the front wheel. By comparing it to the rear wheel speed, it is possible to estimate tire slip and make control decisions. |
| Vehicle speed (rear) [Graph item] |
R-Speed | Measures the rotational speed of the rear wheel. By comparing it to the front wheel speed, it is possible to estimate tire slip and make control decisions. |
| Accelerator opening [Graph item] |
APS | Indicates the rotation angle of the throttle grip operated by the rider. Comparison with the TPS (Throttle Position Sensor) helps determine the level of intervention by the engine control system. |
| PWR setpoint [Graph item] |
PWR | Changes throttle response. The lower the number, the sportier the engine character, while the higher the number is, the milder the engine’s characteristics become. |
| TCS set value [Graph item] |
TCS | Detects differences in speed between the front and rear wheels and works to efficiently extract drive force from the rear tire. |
| QS △ set value [Graph item] |
QS△ | Indicates the operational settings for upshifts using the quick shifter. Enables smooth upshifts without clutch operation. |
| QS▽ Set value [Graph item] |
QS▽ | Indicates the operational settings for downshifts using the quick shifter. Enables smooth downshifts without closing the throttle. |
| SCS set value [Graph item] |
SCS | Detects slides at the rear tire and adjusts engine output to control the slide. |
| LIF setpoint [Graph item] |
LIF | Detects if the front tire rises off the surface when launching from a stop or during acceleration and adjusts engine output to compensate. |
| LCS setpoint [Graph item] |
LCS | Records the mode used during launch control. Helps identify which mode was used at the time of launch. |
| EBM setpoint [Graph item] |
EBM | Controls the level of engine braking when closing the throttle or when downshifting during track riding. Setting 1 is for stronger engine braking, while 2 lessens the level. |
| BSR set value [Graph item] |
BSR | When the rear wheel locks up due to excessive engine braking, this system controls engine torque to help the bike’s behavior. This system also shines in low-grip situations or other scenarios when it is difficult for the slipper clutch to perform. |
| TCS activation flag [Flag item] |
TCS_flg | Flag information indicating that the traction control system was activated. Allows confirmation of the timing when rear-wheel slip suppression was engaged. |
| SCS activation flag [Flag item] |
SCS_flg | Flag information indicating that the slide control system was activated. Detects rear wheel sliding and confirms whether control was applied. |
| FUP activation flag [Flag item] |
LIF_flg | Flag information indicating that the lift control system was activated. Confirms whether front wheel lift was controlled during rapid acceleration. |
| BSR activation flag [Flag item] |
BSR_flg | Flag information indicating that brake slide reduction was activated. Confirms whether rear wheel sliding was suppressed during deceleration. |
| LC activation flag [Flag item] |
LC | Flag information indicating that the launch control system was enabled. Confirms the timing when engine output control was active during launch. |
Share Your Riding Logs


Go to the riding log list or riding log details screen to share your data with contacts of your choice. You can generate and share time-sensitive QR codes and links.
*Some iOS apps (such as X and Gmail) have limitations on how they handle links, which can prevent shared links from opening properly.
*The QR code is valid for 24 hours from the time of issuance.